We use cookies
Using our site means you agree to the use of cookies and similar technologies. Read about our policy and how to disable them here
Climate change remains one of the most significant challenges facing our generation. As a company dedicated to promoting the sport of fencing, Leon Paul recognises the importance of doing our part in the fight to lower global temperatures. This means actively reducing our carbon footprint. Greenhouse gases, especially carbon dioxide, are relatively straightforward to measure, which gives us a tangible starting point for tracking and reducing emissions.
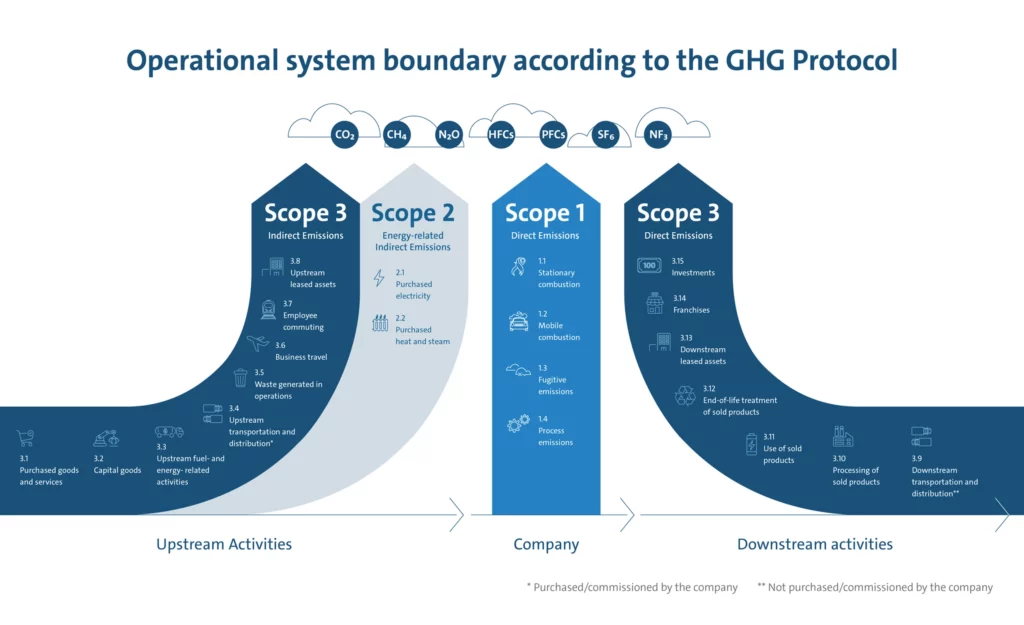
At Leon Paul, we recently took the initiative to calculate our carbon emissions to gain a clear understanding of our environmental impact. Carbon footprinting is commonly divided into three scopes, which allows us to map out where our emissions come from and how we can address them.
Breaking Down the Three Scopes of Carbon Footprinting
When calculating a carbon footprint, emissions are categorised into three scopes:
- Scope 1: Direct Emissions
These are emissions from sources that we directly control. For Leon Paul, this includes the fuel we use for company vehicles and any gas consumption in our facilities.
- Scope 2: Indirect Emissions from Energy
These cover the electricity we use to power our offices, manufacturing spaces, and operations. Although we don't generate the electricity, our use contributes to emissions at the source.
- Scope 3: Other Indirect Emissions
Scope 3 encompasses emissions not directly under our control but related to our business activities. This could include emissions from employee travel, transportation of goods by other companies, waste generation, and the materials we use to create our fencing equipment.

Before starting our assessment, we knew that Scope 3 would be our most considerable emissions output. Manufacturing fencing equipment from raw materials to the end product is an emissions-intensive process involving many parties. While technically, the supply chain is responsible for a large chunk of these emissions, all of our suppliers' decisions regarding their sustainability efforts and emissions also affect us, as they take up a majority of our indirect Scope 3 emissions, even if our only role in the transaction is buying and selling.
With that knowledge, we put our utmost effort into gathering the emissions data that gives us, at the very least, an idea of our scope three emissions so that we may try to reduce them. Here’s how we went about it:
Gathering Activity Data for Each Scope
To accurately measure our carbon footprint, we needed to collect activity data for each of the three scopes:
- Scope 1 Data Collection:
We gathered information on fuel consumption for company vehicles, including litres of petrol or diesel used. Additionally, we tracked the amount of gas used in our office heating systems.
- Scope 2 Data Collection:
For our electricity usage, we referred to our energy bills, which provided data on kilowatt-hours (kWh) of electricity consumed over the year.
A large portion of our Scope 1 and 2 emissions have been dealt with by switching to renewable energy sources.
Scope 3 Data Collection:
Measuring this scope involved collecting a range of data;
What is an Emissions Factor?
Once we had the activity data, we needed to convert it into emissions. This is done using an emissions factor, a conversion rate that turns activity data (e.g., fuel consumed, miles travelled, energy used) into the equivalent amount of GHG emissions.
We used the DEFRA (Department of Environment, Food and Rural Affairs) spreadsheet, which provides standardised emissions factors for different activities and materials. For example, DEFRA provides a factor to convert kWh of electricity into the corresponding amount of CO2 emitted.

Worked Example: Converting Raw Material Usage to Emissions
Given Data:
The emissions factor for steel cans is 3,086.73 kg CO2e per tonne.
For this calculation, let's assume the annual material consumption is 10 tonnes of steel cans.
We will multiply the annual material consumption by the emissions factor for steel cans:
Emissions = 10 tonnes x 3,086.73 kg CO2e / tonne = 30,867.3 kg CO2e
Emissions in tonnes = 30,867.3 kg CO2 / 1,000 = 30.87 tonnes CO2
Using 10 tonnes of steel cans results in 30.87 tonnes of CO2 equivalent emissions for the year.
Assumptions Made During the Process
In some cases, we had to make assumptions due to limitations in the data:
Looking Ahead
This initial exercise has provided us with a clearer picture of our carbon footprint. In the next blog post, we’ll share the results of our carbon footprinting exercise with you.

Winner of the 2024 Kings Award for Enterprise

